1 / 1
A dashboard comparing two pricing experiment variants, showing a row of KPI cards, per variant progress bar cards, an area chart, a vertical timeline summary, and projected revenue and AI summary cards.
 1/2
A/B Pricing Experiment Dashboard in Light and Dark Modes
 @prem_uiux
 1/4
A/B Testing Dashboard with Glowing Progress Bars and Variant Charts
@prem_uiux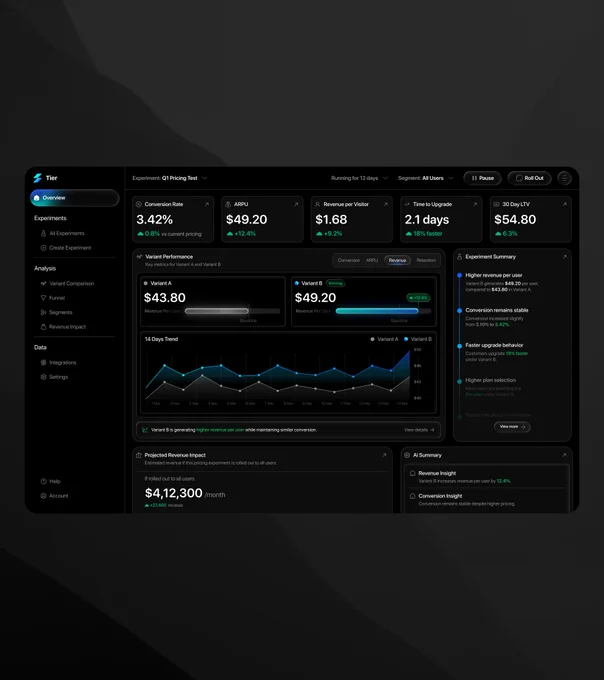 1/2
A/B Pricing Experiment Dashboard in Dark and Light Themes
@prem_uiux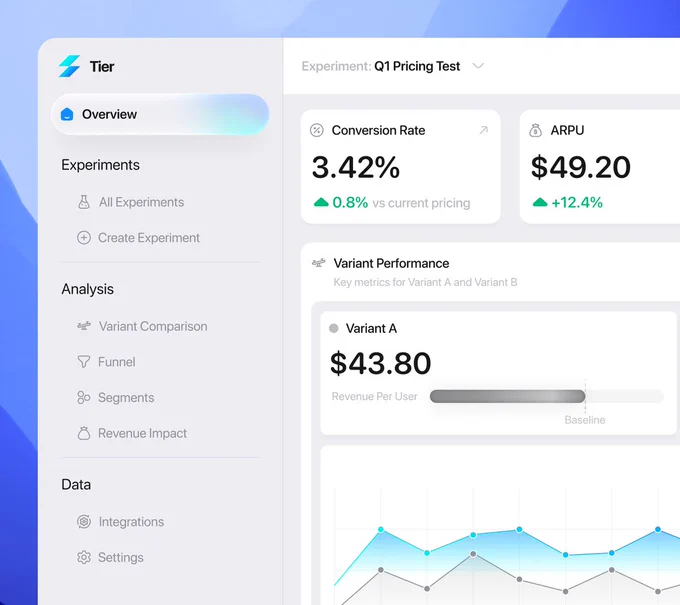
A/B Pricing Experiment SaaS Dashboard with Light Sidebar and Metric Cards
@prem_uiux 1/4
A/B Pricing Experiment Dashboard with Dark Glowing Variant Cards
@prem_uiux
Dark Pricing A/B Test Dashboard with Variant Comparison and Trend Chart
@prem_uiux