1 / 4
Overview screen with a large margin figure card, a 12-week hatched bar chart, a waterfall chart of losses against target, a gradient insight card and an action list.

E-commerce Sales Dashboard with Donut Chart and Orders Table
 @rakibulism
 1/4
Four SaaS Dashboards on Watercolor Backdrops with Sidebar and Card Grids
 @prem_uiux
 1/2
Two Dark SaaS Dashboard Styles — Rounded Violet and Angular Monochrome
 @tobybelhome
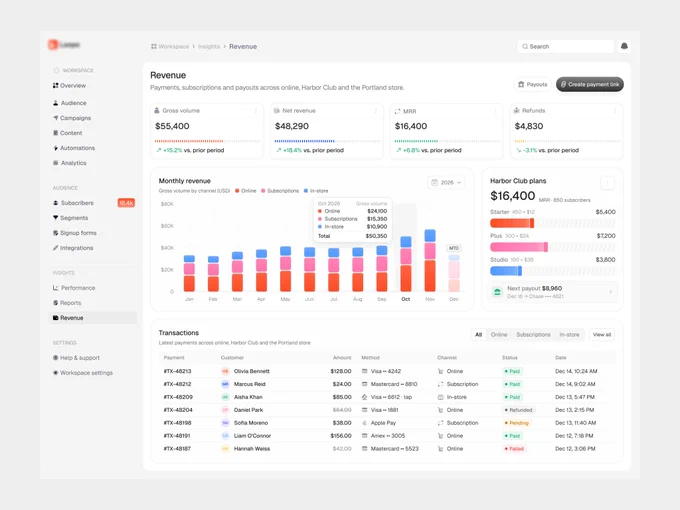
Revenue Dashboard with Stacked Bar Chart, Stat Cards and Transactions Table
 @jubayer6910
 1/4
Payments Analytics Dashboard with Deep Green Card Grid and AI Insights
 @nizamdesign

Time Tracking Dashboard with Timeline Bars and Card Widgets
 @panzestudio