1 / 1
A demo video of a dark spend card with a budget-width, usage-length donut chart and category table, where hovering swaps the center value, clicking rotates the chart to drill in, and the period dropdown is switched.
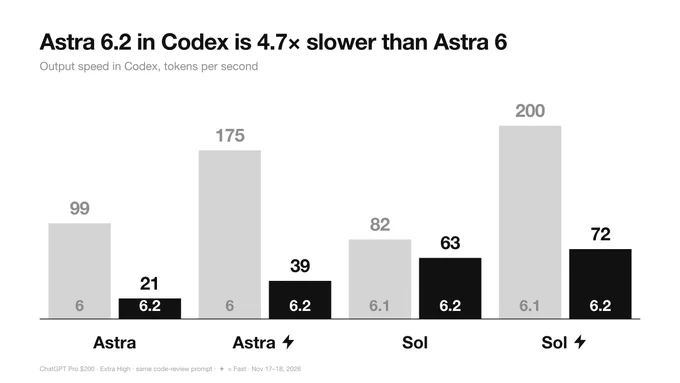
Monochrome Grouped Bar Chart Comparing Model Versions
 @miu21590
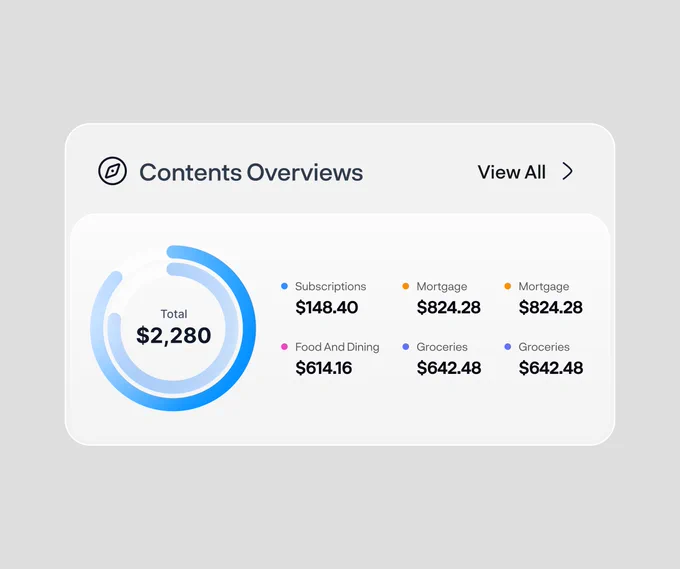
Spending Overview Widget with Dual Donut Chart and Category Legend
 @rakibulism
 1/12
Service Outage Monitor with Logo and Sparkline Status Cards
 @marcelkargul

Analytics Metric Detail Sheet in Light and Dark Modes
 @faizalsukaimi
 1/2
Restaurant Operations Analytics Cards with Hexagon Cell Chart and Trend Graphs
 @nizamdesign
 0:09
On-call Load Widget with Day-by-Hour Heatmap and Hover Tooltips
 @disarto_max