1 / 1
A dark mode business integration dashboard with a 100-day per-workstream Gantt timeline, a right-side day grid and progress cards, and a list of late and blocked tasks below.

E-commerce Sales Dashboard with Donut Chart and Orders Table
 @rakibulism

Proposal Management SaaS — Scope Change Detection Modal
 @nizamdesign

Security Scan Repository Dashboard in a Four-Step Flow
 @jubayer6910
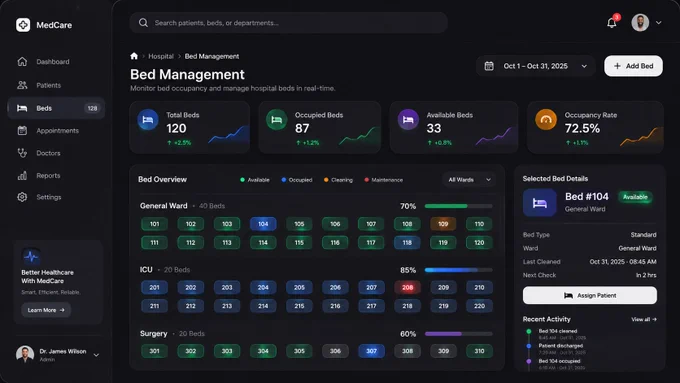
Bed Management Dashboard with Color-Coded Bed Grid and Detail Panel
 @iammuhammadmuiz
 1/2
Two Dark SaaS Dashboard Styles — Rounded Violet and Angular Monochrome
 @tobybelhome
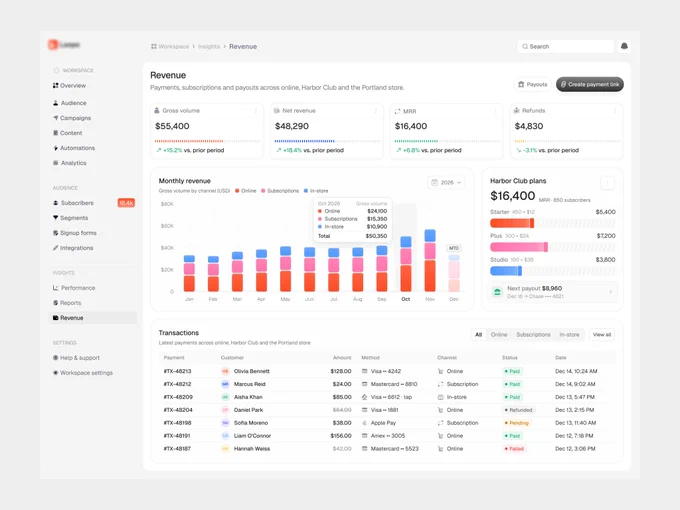
Revenue Dashboard with Stacked Bar Chart, Stat Cards and Transactions Table
@jubayer6910