1 / 1
In a dark Gantt chart, the cursor drags a task bar edge to extend its duration, updating successors and progress, then the scale switches from month to quarter and year, compressing the bars.
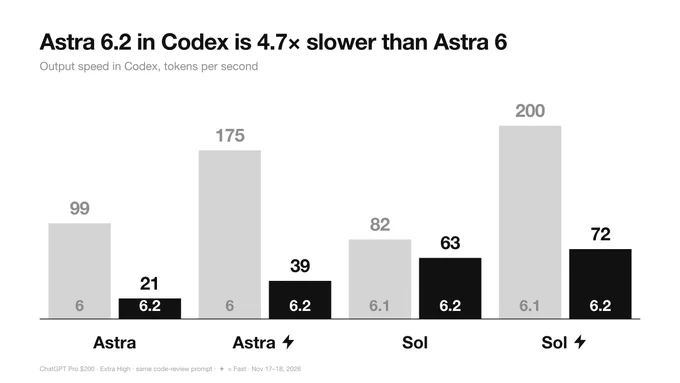
Monochrome Grouped Bar Chart Comparing Model Versions
 @miu21590
 0:17
Storage Cleanup Panel with Sunburst Chart and Toggle List
 @disarto_max
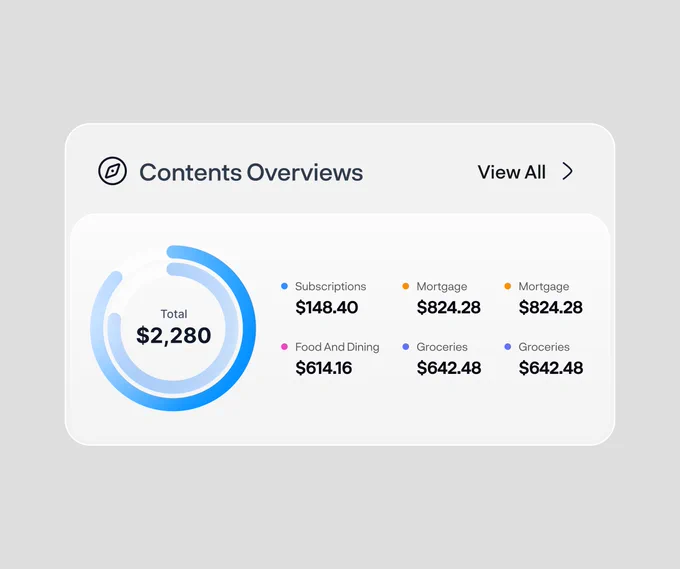
Spending Overview Widget with Dual Donut Chart and Category Legend
 @rakibulism
 1/12
Service Outage Monitor with Logo and Sparkline Status Cards
 @marcelkargul

AI Token Budget Planner with Tick Slider and Dark Spend Panel
 @faizalsukaimi
 0:16
Cycling Ride Recap Card with Contour Route Map and Elevation Scrubbing
@disarto_max