1 / 4
A lead pipeline dashboard with period segmented tabs, large statistics, a stage-by-stage funnel bar chart with a tooltip, a monthly calendar, and a deadline-sorted attention table.

E-commerce Sales Dashboard with Donut Chart and Orders Table
 @rakibulism

Proposal Management SaaS — Scope Change Detection Modal
 @nizamdesign

Security Scan Repository Dashboard in a Four-Step Flow
 @jubayer6910
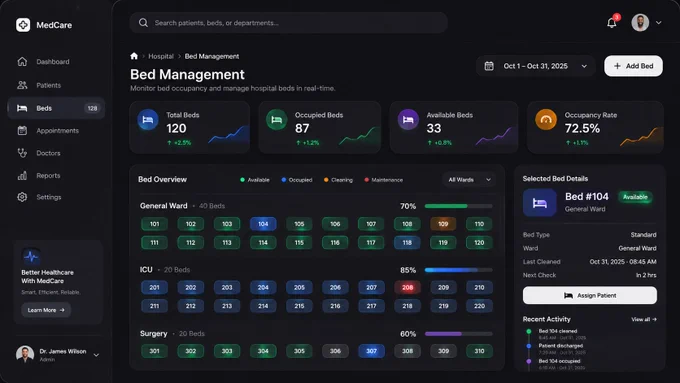
Bed Management Dashboard with Color-Coded Bed Grid and Detail Panel
 @iammuhammadmuiz
 1/2
Two Dark SaaS Dashboard Styles — Rounded Violet and Angular Monochrome
 @tobybelhome
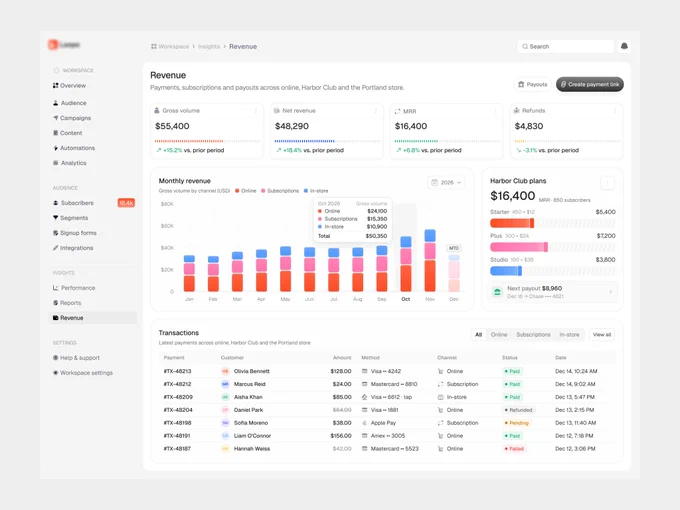
Revenue Dashboard with Stacked Bar Chart, Stat Cards and Transactions Table
@jubayer6910