1 / 1
A screen recording scrolling top to bottom through a two column grid of empty state variants; hovering a cell reveals code and preview toggle icons and applies a button hover shade.

Analytics Metric Detail Sheet in Light and Dark Modes
 @faizalsukaimi
 1/4
Web3 App Design System with Dark UI and Pink Accent Components
 @jaydwivedi_

Dark Mode Interactive Components — Sortable List, Date Picker, Tree, Stepper
@faizalsukaimi
Typeahead Autocomplete with Avatar Results in Light and Dark Themes
@faizalsukaimi 1/4
Light UI Component Collection — Event Card, Upload, Workflow Nodes
 @disarto_max
 1/3
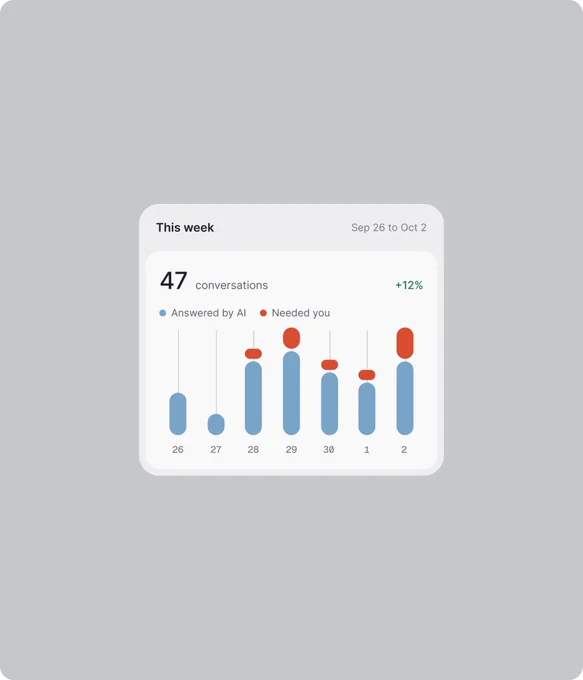
SaaS Dashboard Cards: Weekly Chart, Metric Check, Activity Feed
 @nizamdesign