An infographic overlaying a range box, dashed levels, arrow callouts, an upper-left numbered list card, and a bottom key-idea card on a black candlestick chart.
Scientific data visualization with diverging colormap scatter and cross-section
Figma Mockup Workflow for a SaaS Dashboard Presentation Shot
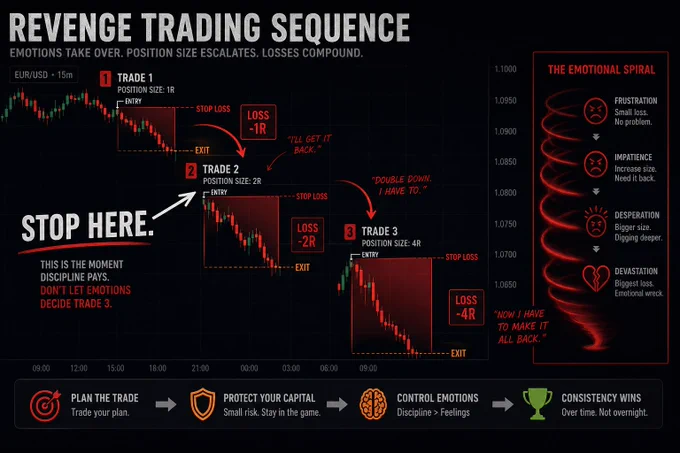
Trading Psychology Infographic on a Dark Annotated Candlestick Chart