1 / 1
An analytics component where a donut chart holding a total figure sits beside a per channel list of amounts, order counts, and change rates inside a white card.
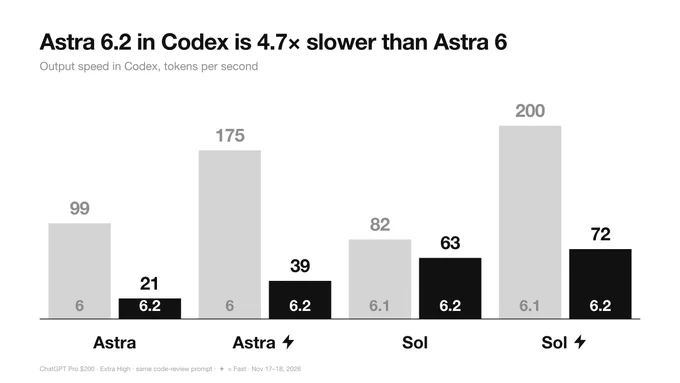
Monochrome Grouped Bar Chart Comparing Model Versions
 @miu21590
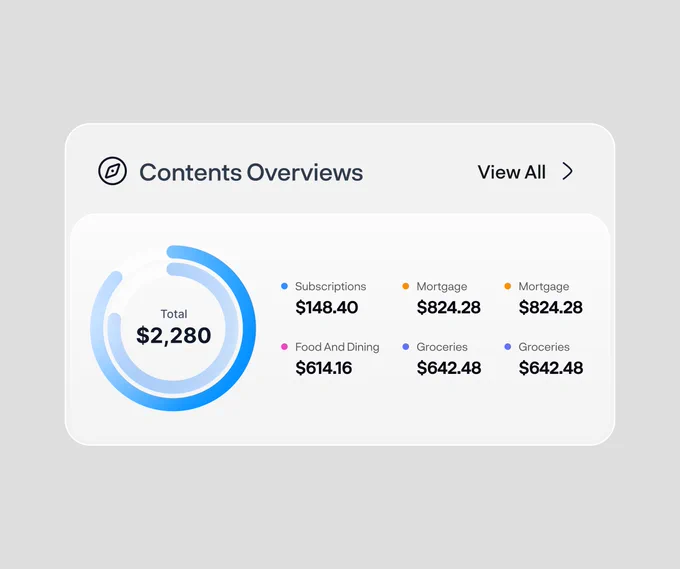
Spending Overview Widget with Dual Donut Chart and Category Legend
 @rakibulism
 1/12
Service Outage Monitor with Logo and Sparkline Status Cards
 @marcelkargul

Analytics Metric Detail Sheet in Light and Dark Modes
 @faizalsukaimi
 1/2
Restaurant Operations Analytics Cards with Hexagon Cell Chart and Trend Graphs
 @nizamdesign
 0:09
On-call Load Widget with Day-by-Hour Heatmap and Hover Tooltips
 @disarto_max