1 / 1
A screen recording of an AI agent operations dashboard moving from the overview to the trace list and a trace detail waterfall, showing card fade-ins, tab switching, and table rows appearing in sequence.

AI Agent Pipeline Dashboard with Trace Timeline
 @marcelkargul

E-commerce Sales Dashboard with Donut Chart and Orders Table
 @rakibulism

Proposal Management SaaS — Scope Change Detection Modal
 @nizamdesign
 1/4
Four SaaS Dashboards on Watercolor Backdrops with Sidebar and Card Grids
 @prem_uiux

Security Scan Repository Dashboard in a Four-Step Flow
 @jubayer6910
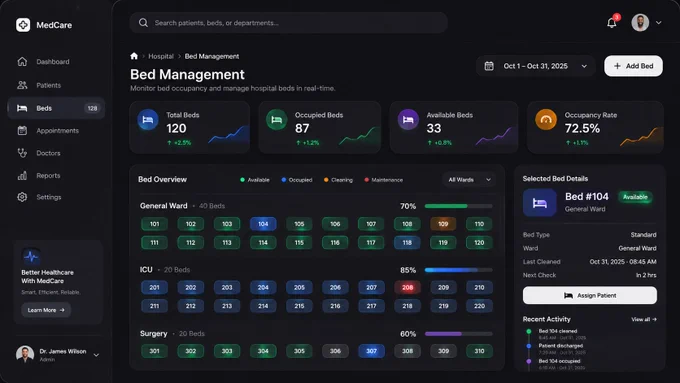
Bed Management Dashboard with Color-Coded Bed Grid and Detail Panel
 @iammuhammadmuiz