1 / 1
A sequence on a compliance overview dashboard where switching the period between this month, next month, and this quarter updates the numbers, and hovering the completed and upcoming cards opens popovers with line charts and detailed counts.

E-commerce Sales Dashboard with Donut Chart and Orders Table
 @rakibulism
 1/4
Four SaaS Dashboards on Watercolor Backdrops with Sidebar and Card Grids
 @prem_uiux
 1/2
Two Dark SaaS Dashboard Styles — Rounded Violet and Angular Monochrome
 @tobybelhome
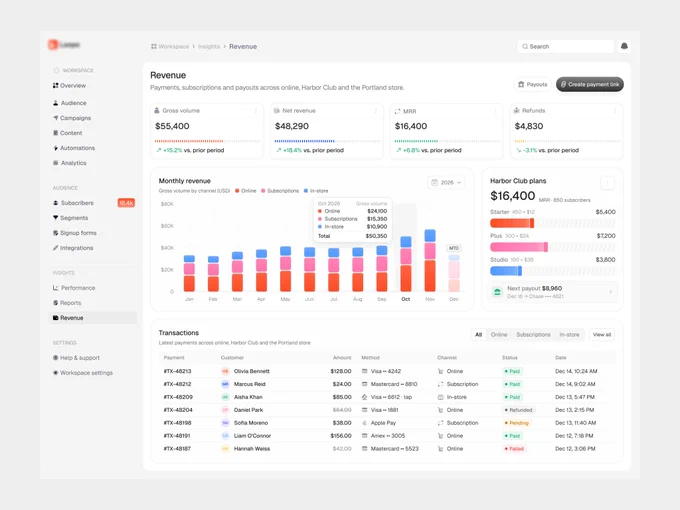
Revenue Dashboard with Stacked Bar Chart, Stat Cards and Transactions Table
 @jubayer6910
 1/4
Payments Analytics Dashboard with Deep Green Card Grid and AI Insights
 @nizamdesign

Time Tracking Dashboard with Timeline Bars and Card Widgets
 @panzestudio