Dark Bar Chart Infographic Comparing Plan Value
Ecosystem Comparison Infographic with an Icon Card Grid
Trading Education Infographic with Red-Green Split Comparison
Web3 Comparison Infographic with Two-Column Contrast Table
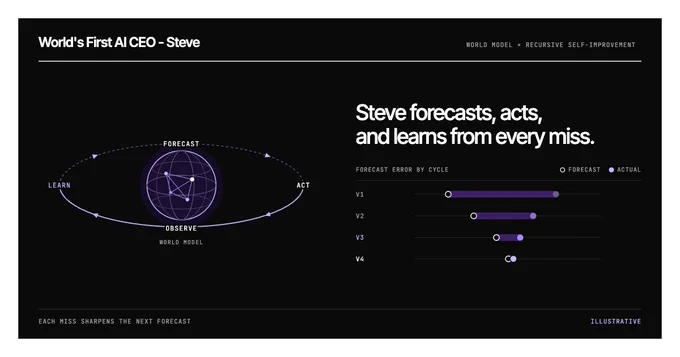
AI Agent Intro Card with Dark Loop Diagram and Dumbbell Chart
UI vs UX Iceberg Infographic with 3D Illustration
Design Elements and Principles Infographic with Orange Serif Title
Deployment evolution infographic - three-panel card comparison
UX Comparison Infographic with Labeled vs Raw Value Cards
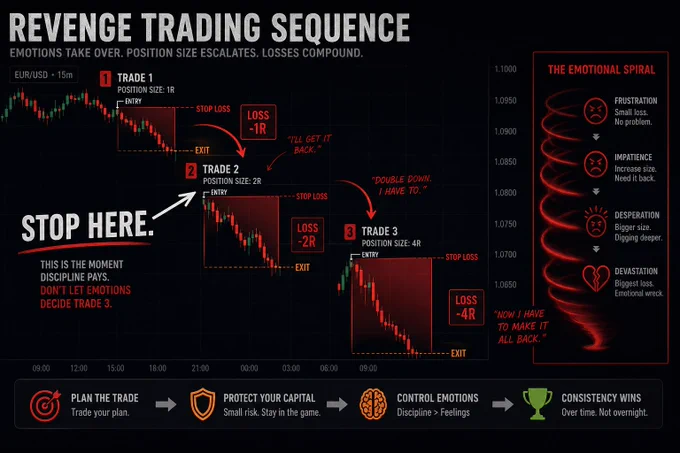
Trading Psychology Infographic on a Dark Annotated Candlestick Chart