1 / 1
A chart graphic on a dark background comparing three plans' converted value with coral, gray, and purple-gradient bars and large white figures, with logos, names, and score badges aligned below.
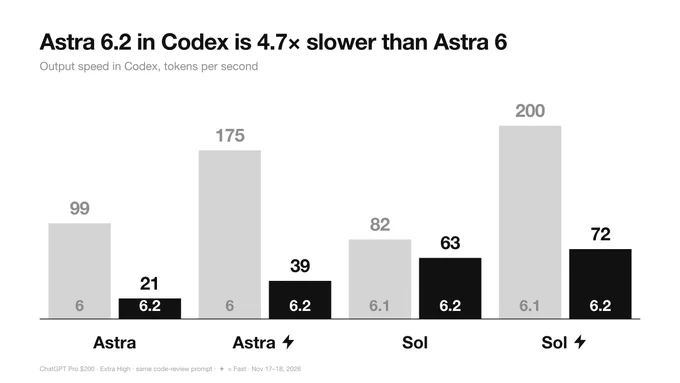
Monochrome Grouped Bar Chart Comparing Model Versions
 @miu21590
 1/4
Tactile UI Components — Text Formatting Toolbar and Status Badges
 @jaydwivedi_
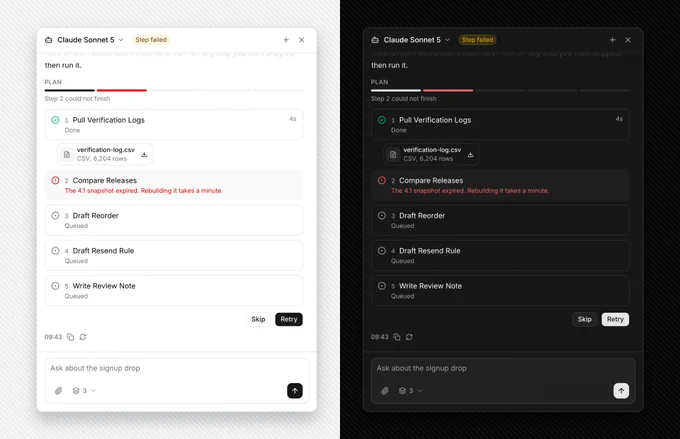
AI Agent Side Panel with Failed Step Retry and Skip Plan
 @faizalsukaimi

AI Token Budget Planner with Tick Slider and Dark Spend Panel
@faizalsukaimi 1/2
SaaS Footer with an Ask-AI Icon Button Row in Light and Dark Modes
 @louisnstudio
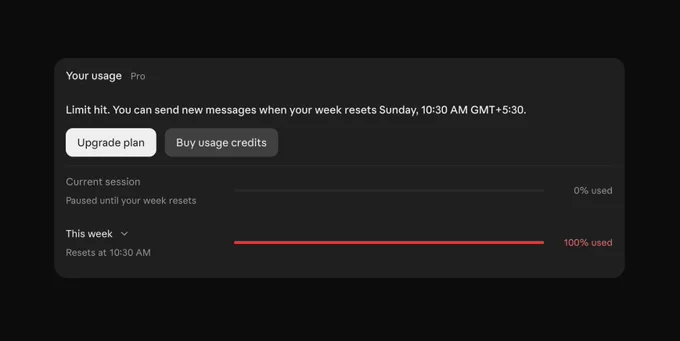
AI Tool Usage Limit Card with Dark Mode Progress Bars
 @prem_uiux